Loyalty Data Flows Across Casino Regions Expose Retention Pattern Evolutions
Parker Vogel · Aug 2, 2026
Loyalty Data Flows Across Casino Regions Expose Retention Pattern Evolutions
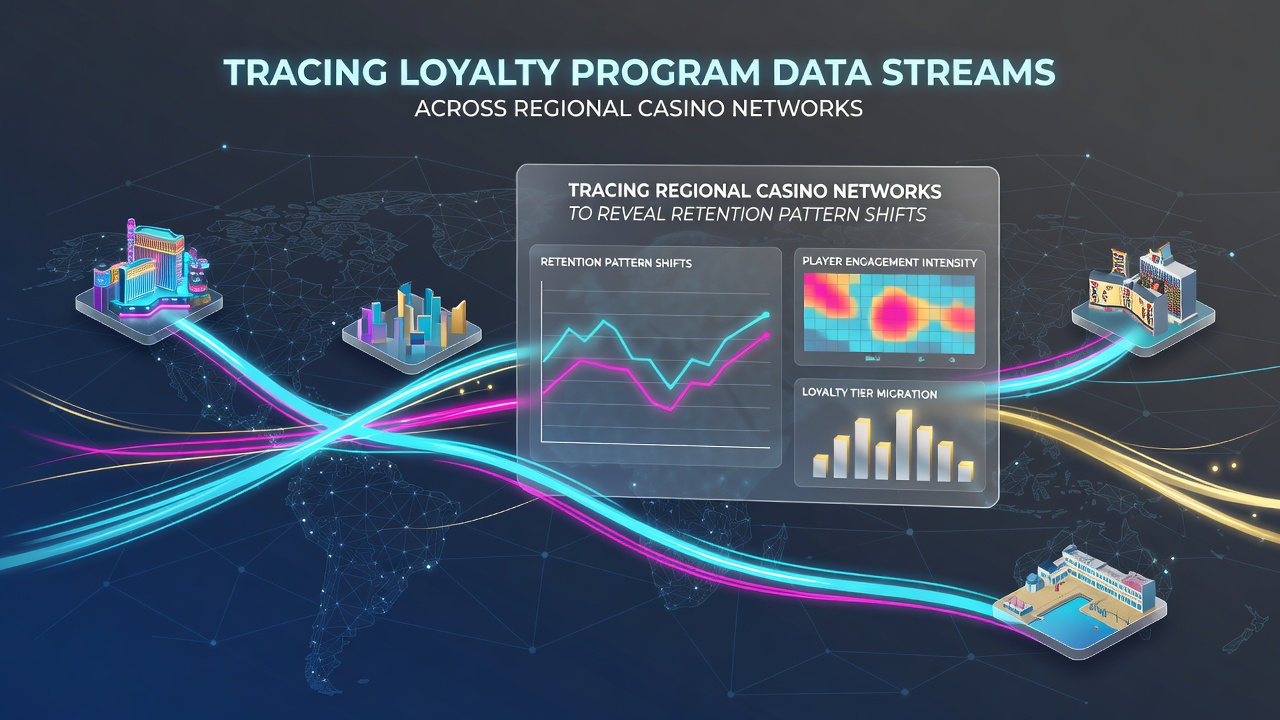
Regional casino operators collect loyalty program information from player cards and mobile apps then route those records through centralized data streams that connect properties across state and provincial lines, and this aggregation process lets analysts compare retention metrics from one market to another in real time. Networks in the western United States and parts of Canada feed transaction details into shared platforms where algorithms flag when reward redemption rates or visit frequencies begin to diverge from historical baselines.
How Data Streams Move Between Properties
Each swipe of a loyalty card at a slot machine or table game generates a timestamped record that travels from the property management system to a regional hub, and those hubs combine the entries with demographic tags before forwarding summarized packets to corporate analytics teams. Operators track card-linked spend, point accumulation, and redemption events across multiple jurisdictions so they can spot when players reduce activity in one location while increasing it in another. The resulting datasets reveal whether retention shifts stem from local promotions, competitor openings, or broader economic factors.
Technicians maintain secure pipelines that encrypt player identifiers during transit yet preserve enough detail for pattern matching, and these pipelines operate continuously with daily batch updates plus live feeds for high-value accounts. When a regional network adds a new property the integration team maps its loyalty schema to the existing structure so historical comparisons remain valid.
Retention Pattern Shifts Detected in Recent Periods
Figures compiled through mid-2026 show that several multi-state groups recorded a noticeable drop in repeat visits from players who previously visited at least once per quarter, while the same cohorts maintained steady activity at properties located in different regulatory environments. Analysts attribute part of the change to adjustments in point earning rates that took effect earlier that year, and they cross-reference the data with external indicators such as regional employment statistics to isolate program effects from outside influences.

One documented case involved a group operating sites in Nevada and Arizona where the data streams indicated a migration of mid-tier reward members toward the Arizona locations after a tier qualification threshold changed, and the shift appeared within six weeks of the policy update. Similar patterns emerged in Canadian networks spanning Ontario and British Columbia when operators introduced cross-property bonus multipliers limited to certain months.
Tools and Methods Used for Pattern Detection
Specialized software platforms ingest the aggregated streams then apply clustering techniques that group players by behavioral segments before measuring retention velocity within each cluster, and these systems generate alerts when a segment's activity index falls outside expected ranges. Regulatory filings from bodies such as the National Indian Gaming Commission note that tribes participating in multi-site loyalty arrangements must maintain audit trails of how player data moves between facilities.
Researchers at institutions including the Australian Gambling Research Centre have examined comparable data architectures and found that combining loyalty streams with external weather or event calendars improves the accuracy of retention forecasts. The same studies indicate that networks employing machine-learning models detect subtle early signals of disengagement up to eight weeks sooner than traditional reporting methods.
Regional Differences and Their Data Signatures
Markets with higher tourist concentrations tend to show greater week-to-week volatility in loyalty card activity compared with commuter-driven regions, and the data streams capture these differences through metrics such as average days between visits and average coin-in per session. Observers note that properties near international borders sometimes register cross-border player flows that appear as retention gains in one jurisdiction and losses in another when currency exchange rates fluctuate.
During August 2026 several networks reported an uptick in redemption of non-gaming rewards such as hotel stays and dining credits, and the streams indicated these redemptions correlated with longer visit durations even when gaming spend remained flat. Analysts continue to monitor whether this pattern persists or represents a temporary response to seasonal promotions.
Conclusion
Tracing loyalty program data streams across regional casino networks supplies operators with granular visibility into retention dynamics that single-site reports cannot provide, and continued refinement of these analytical approaches supports more precise allocation of marketing resources. As additional properties join shared platforms the volume and resolution of available data increase, which in turn allows finer detection of pattern shifts tied to policy changes, competitive moves, or macroeconomic conditions.