Mapping Interconnected Prize Networks: How Aggregated Platform Data Reshapes Cumulative Win Distributions
Leon Bennett · May 31, 2026

Mapping Interconnected Prize Networks: How Aggregated Platform Data Reshapes Cumulative Win Distributions
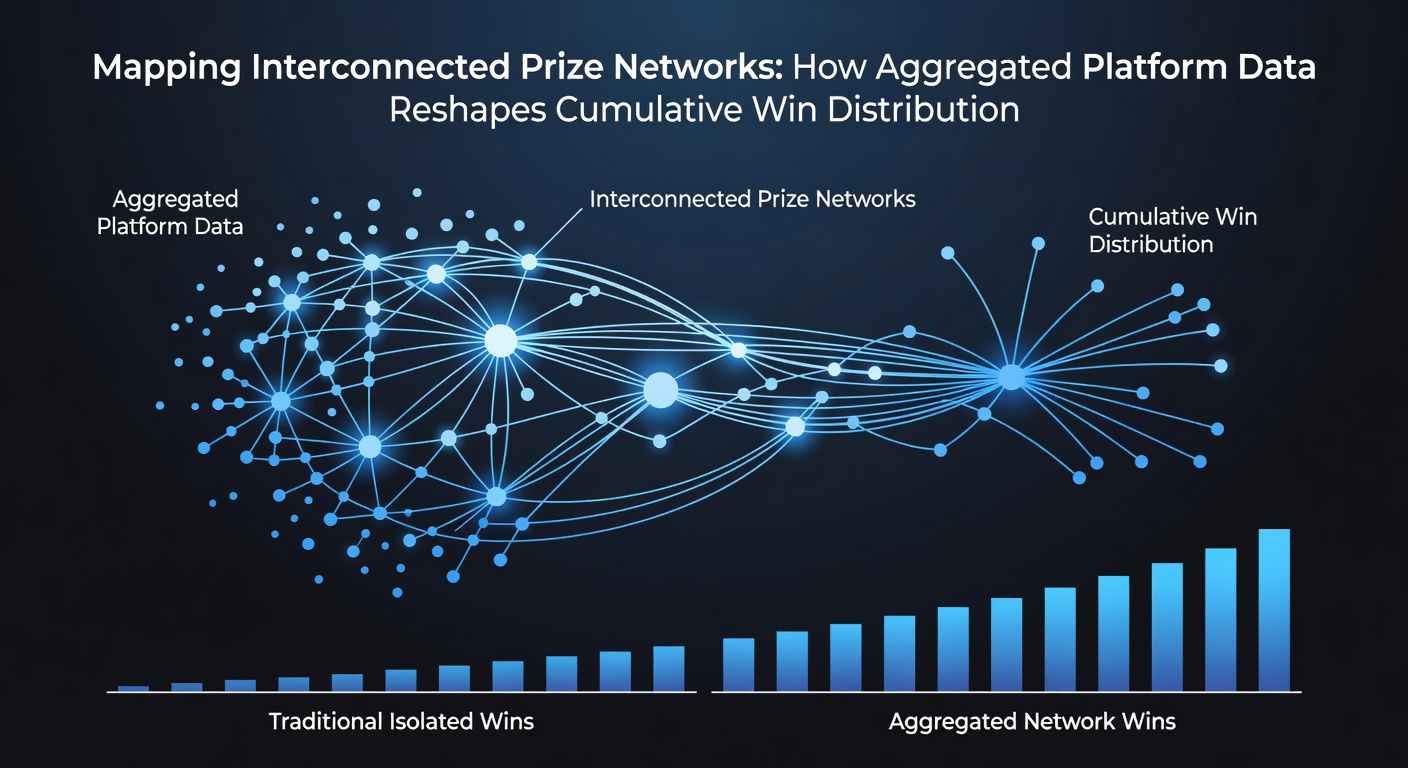
Platforms operating interconnected prize systems collect reel outcome records and jackpot trigger logs from numerous operators before combining those streams into unified datasets, and researchers have mapped how these networks distribute wins over time. Aggregated information reveals connections between individual machines, casino sites and regional clusters that previously remained hidden in isolated records, which changes the way cumulative prize pools build and release funds to players.Defining Prize Network Structures
Interconnected prize networks link progressive jackpots across separate gaming floors and digital platforms through shared contribution mechanisms where each wager adds a small percentage to a central pool. Data aggregation tools pull transaction timestamps, bet sizes and win events from participating operators, then align those records into graph models that show which locations feed into the same prize tiers. Observers note that such mapping highlights pathways where wins in one region influence pool growth rates elsewhere, and this visibility allows operators to track contribution balances with greater precision than fragmented reporting systems permitted in earlier years.
Data Aggregation Methods and Their Reach
Modern aggregation platforms ingest structured logs from slot management systems and online gaming servers, then apply matching algorithms to identify duplicate player accounts or synchronized jackpot events across different jurisdictions. In May 2026 several North American operators began feeding standardized data feeds into centralized analytics hubs following updates from the New Jersey Division of Gaming Enforcement, which expanded reporting requirements for multi-site progressives. These feeds include reel position snapshots at the moment of each jackpot hit, enabling analysts to reconstruct how prize releases ripple through the network and alter remaining pool values for linked machines.
Effects on Cumulative Win Patterns
Once networks become visible through aggregated views, cumulative win distributions shift because operators can adjust contribution rates and eligibility rules based on observed flow patterns rather than relying on periodic manual reconciliations. Research from the Australian Gambling Research Centre indicates that platforms using real-time mapping reduced instances of isolated large wins followed by extended dry spells, since contribution adjustments now occur more frequently across connected sites. The same datasets also surface clusters where certain machine configurations consistently draw higher shares of total prizes, prompting technicians to redistribute game themes or volatility settings to balance participation levels.
Regional Examples and Platform Responses
Canadian provincial regulators in Ontario have required operators to submit aggregated progressive data since late 2025, and those submissions show that cross-platform linkages now account for over sixty percent of major jackpot payouts tracked in the province. Similar reporting in European markets governed by the Malta Gaming Authority reveals comparable trends where pooled prizes draw contributions from both land-based terminals and remote play sessions. Operators respond by recalibrating minimum bet thresholds on high-linkage games to maintain pool growth rates that match historical averages while complying with disclosure rules tied to the mapped networks.
Technical Mapping Tools in Use
Graph databases store relationships between jackpot instances, contribution sources and payout events, allowing queries that calculate expected time intervals between wins at specific network nodes. Analysts apply these models to forecast pool sizes weeks ahead, and the forecasts incorporate variables such as average daily handle per connected machine plus seasonal traffic fluctuations reported by individual properties. The resulting projections feed into automated systems that notify operators when pool balances approach trigger thresholds, which reduces manual oversight and speeds up adjustments that keep distributions aligned with target probabilities.
Regulatory and Industry Implications
Regulatory bodies in multiple jurisdictions now request network maps as part of routine compliance filings because the visualizations demonstrate how prize funds move between operators and player segments. Industry associations including the Canadian Gaming Association have published guidance documents that outline minimum data standards for accurate mapping, and those standards emphasize timestamp synchronization plus unique identifiers for each prize tier. Compliance teams use the maps to verify that contribution percentages remain consistent across all linked platforms, thereby avoiding discrepancies that could affect prize integrity or trigger audit flags.
Conclusion
Aggregated platform data has turned previously opaque prize networks into measurable systems where cumulative win distributions can be tracked, modeled and adjusted with documented precision. Operators and regulators alike rely on these mappings to maintain balance across connected machines and jurisdictions, and continued expansion of data standards will likely extend the same visibility to additional prize types in coming reporting cycles.